In this blog, I compare the electricity generation in February 2017 to the same period last year.
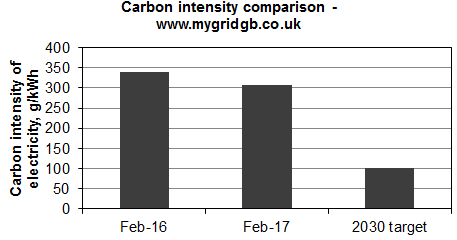
For readers concerned about carbon emissions, there is good news. Electricity was less carbon intensive and there was lower demand in February 2017 than there was for the same month in 2016. Overall there was 11% less greenhouse gas from British power stations in February 2017 than in February 2016. This is shown on the chart below.

There are two big reasons for the fall in carbon emissions. Firstly, 40% less electricity was generated from coal power and there was a 29% increase in output from our wind turbines. Gas, hydro, coal, nuclear and solar generation was fairly consistent. Imports fell due to outage of the major interconnector with France: we were unable to import for much of the month.
The two pie charts below which compare the electricity generation in February 2016 and February 2017. Here you can see the falling coal use and rising wind production.

Readers of this blog will know that in 2016, electricity generation from coal fell to record lows. However, in January 2017, many coal power stations were switched back on and coal generation was higher than the year before. This means that, so far in 2017, we have had a month of rising carbon emissions (January) and a month of falling carbon emissions (February). Time will tell whether coal generation will be even lower in this year.
Falling coal use has contributed to lower carbon emissions which is good news. However, carbon emissions were still unsustainably high in February 2017. Overall, 300g of CO2 was produced per kWh of electricity: that is more than 3 times the 2030 target set by the Committee on Climate Change of 50-100g/kWh.
Investment in low carbon generation or more efficient use of energy is the only way to hit our targets for reduced greenhouse gas emissions. I propose a method for doing so with the MyGridGB Manifesto for low carbon electricity which is simulated on this website.
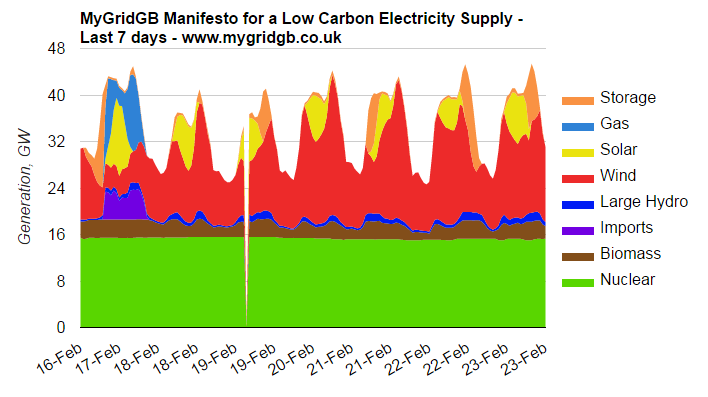
Under my manifesto, carbon emissions would have been around 60gCO2/kWh (the 2030 target is 50-100gCO2/kWh). The manifesto works because it sees better utilisation of windy conditions through more off-shore wind farms and better harnessing of the sun. Gas is only used when it was either dark, there was little wind and energy storage facilities are depleted – in doing so, I reduce gas volumes to a level where biogas can play a significant role. For over 60% of the time, Britain would have run on 100% low carbon electricity under my manifesto.
This can be seen in the chart below which is a simulation of how British electricity could have been generated had we invested in my manifesto. It reflects the actual electricity demand as well as the weather conditions in the UK. As you see, a modest increase in wind, solar, nuclear and storage can mean prolonged periods of low carbon electricity. Under my manifesto, gas power stations can be used, but only when there is insufficient low carbon generation. This approach means we can hit our carbon targets and release sustainable amounts of greenhouse gas.
You can read more about my manifesto in actions here.

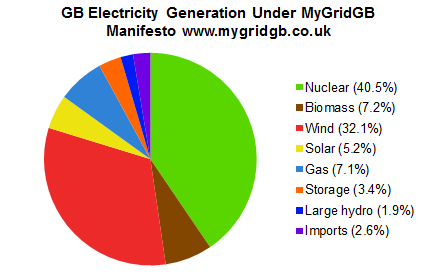
The following pie chart reflects the generation mix under my manifesto had it been implemented in February 2017. Looking at this chart, you see how bulk electricity could have been generated from wind turbines and nuclear power stations. That is a remarkable shift from a country which is presently addicted to gas.

Every month, I try to track the stories in British electricity generation based on the numbers on this site. To see results from previous months, click here.
Summary
- The carbon intensity of electricity was 9.67% lower in February 2017 than February 2016. It fell from 340 gCO2eq./kWh to 307 gCO2eq./kWh.
- Overall, British power stations emitted 11% less carbon this month.
- Coal consumption was 40% lower in February 2017 than February 2016.
- Imports were 60% lower in February 2017 than February 2016.
- Wind generation was 29% higher in February 2017 than February 2016.

