British electricity generation and carbon emissions since 1970.
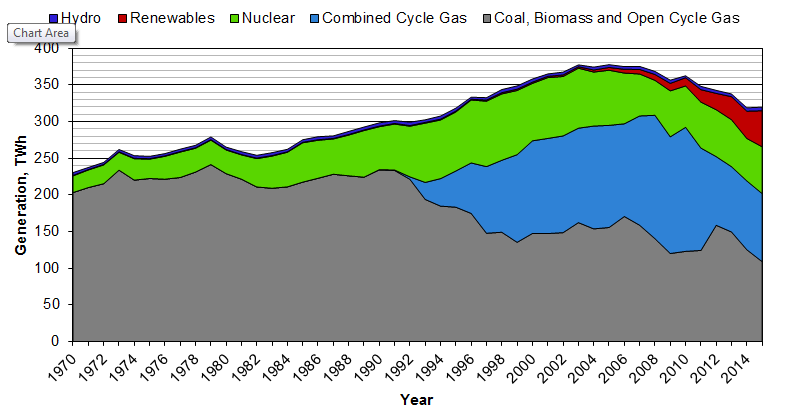
British electricity supply is constantly evolving as the availability of new technology and new directives affect the power stations which are constructed. Change is something which the industry has had to embrace and it is why I don’t fear the change that is needed to bring about low carbon electricity. The chart below shows how British electricity has been generated since 1970 according to data from the UK Government.
Since 1970, there have been three distinct periods of change:
- Between 1930 and around 1992, electricity demand grew steadily and was met by a mix of coal, gas and a growing fleet of nuclear power stations.
- From 1992 to around 2004, electricity demand grew more rapidly and Combined Cycle Gas Turbines (CCGT) were added to the mix. Some conventional power stations using steam were decommissioned in this time.
- From 2004 onwards electricity demand fell and there was an increasing contribution from wind and solar power stations.

Figure 1: UK electricity supply mix 1970 to 2015 (Department of Business Innovation and Skills, 2016)
Carbon Emissions
Over this period, British dependence on coal for electricity, domestic heating and heavy industry collapsed. Britain produced nearly 150MT of coal in 1970. By 2015, it was consuming less than 60MT.
The reduced dependence on electricity produced from coal has reduced the amount of greenhouse gas created for every unit of electricity. Using figures listed here we can look at how the carbon in electricity has changed.
As a reminder of a few concepts:
- The Committee on Climate Change has a target that for every kWh of electricity generated between 50 and 100 grams of carbon dioxide (or equivalent) are released into the atmosphere. The units are written as “gCO2eq./kWh”.
- In 2016, the carbon intensity of British electricity was 379gCO2eq/kWh: nearly 4x the target.
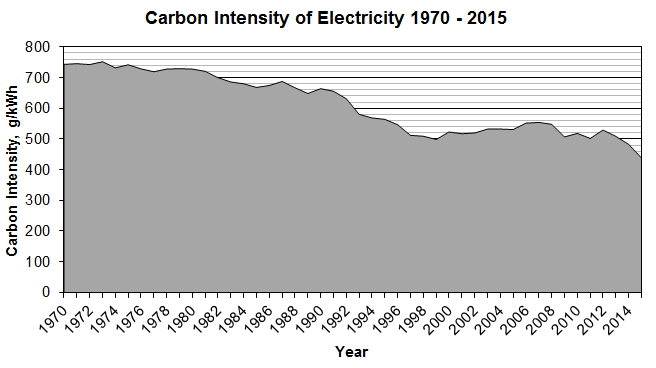
In 1970, I estimate that electricity produced around 750gCO2eq./kWh of electricity. By 2015, that had fallen to less than 450gCO2eq./kWh. In theory that means that British electricity was at least 40% cleaner in 2016 than it was in 1970.
Efficiency improvements in power stations are not included in my simple analysis (as I do not have the data) and would mean bigger improvements in carbon emissions than shown here.

Figure 2: Greenhouse gas emissions per unit of electricity produced
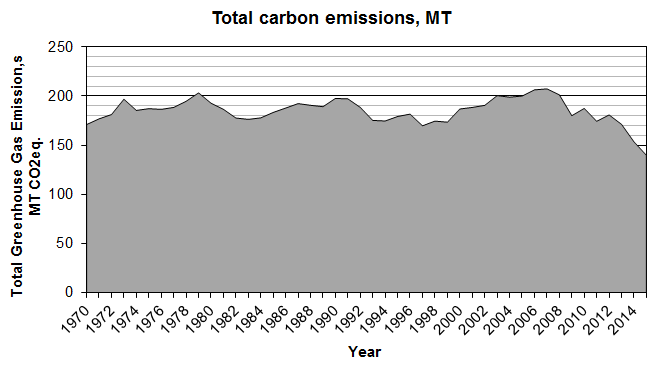
Although electricity has been getting “greener” over the last 45 years, demand for power grew at the end of the last millennium. So although electricity got greener for every unit generated, demand increased and so the volume of carbon released into the atmosphere since 1970 slowly rose until 2008. It is only recently with the advent of renewable energy and falling demand that total emissions of greenhouse gas have actually fallen.
In fact, carbon emissions only fell below 1970 levels in 2014.

Figure 3: Total greenhouse gas emissions of UK electricity
The learning from this is clear – decarbonisation does reduce the greenhouse impact of our electricity supply but that can be offset by increasing demand for energy.
Summary
- British electricity undergoes constant change – the transition to low carbon power is just one of those phases
- British electricity releases 40% less carbon today than it did in 1970 per unit of electricity generated
- Increasing demand meant that for many years the amount of carbon released to atmosphere would only have fallen through efficiency improvements in power stations.
- Recent investment in renewable generation has lead to sustained falls in carbon emissions.

